ABAP runtime trace. How to create it? How to understand results?
You could find some problems that are impossible to understand just using the debugger or standard reports. For some of these problems ABAP runtime trace comes quite useful. These problems could be:
- long execution of system actions;
- problems that occur very rare and it is hard to figure out the cause;
- problems requiring to understand a full tree of ABAP stack, to know how many times some program was executed and where it was called from.
Instruments to perform ABAP trace
There is a lot of standard SAP GUI instruments for runtime tracing (and a lot more for other kinds of tracing). These are the 2 I usually use:
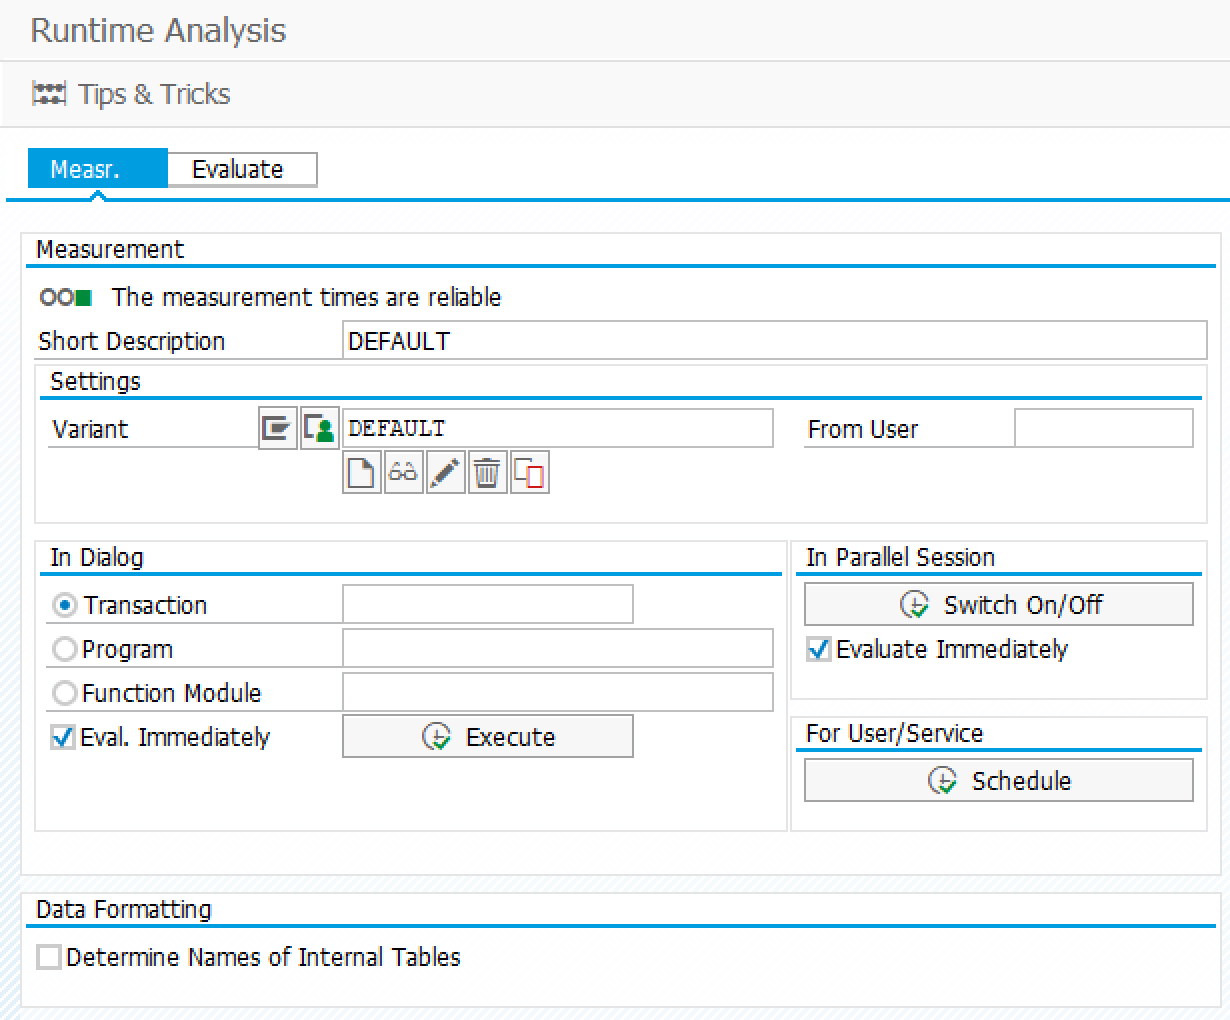
- Transaction SAT -- ABAP Trace transaction. More modern transaction, pretty easy to use, a lot of functions including creation of trace, seeing results in hits of each program including Gross time and Net time.
- Transaction ST12 -- Single transaction analys. The same, but much more powerfull transaction in some cases. It is older and not supported anymore by SAP. But for some actions, like reviewing time taken for programs to execute in the hierarchy of ABAP stack, it is a must. Another important point is that it has an import function and you can transfer the data "from" SAT transaction "to" ST12 transaction, which makes it even more powerfull.
I use the SAT transaction and suggest you to do the same. If you undestand, that you need something more, you always can export to the ST12 transaction. Export is performed in 2 steps: first export the data from SAT to the a, then import the date to ST12 from the file.
How to create ABAP Trace in SAT transaction
If you are not sure what to use, it is better to start from SAT transaction.
- Go to SAT transaction.

- Decide what you want to trace.
To be continued...
Verified systems
- SAP EWM 9.4
Provide feedback
If you have comments or suggestions, please feel free to:
- Reply on X/Twitter.
- Leave a comment on our Telegram Channel.
